Schema Visualization: ORM and LPG Diagrams
A comparison of object-role modeling (ORM) and labeled-property graph (LPG) diagrams for schema visualization.
Introduction
Visualizations are extremely helpful when building a schematic model of a relational knowledge graph (RKG).
A graph schema defines the node, edge, and hyperedge labels in a graph and the rules governing how they are connected and populated. Two diagramming methods are particularly useful for visualizing graph schema:
- Labeled-property graph (opens in a new tab) (LPG) diagrams.
- Object-role modeling (opens in a new tab) (ORM) diagrams.
A Rel graph can fully capture schema diagrammed using either method.
Overall Comparison
LPG Diagrams
LPG diagrams are ideal for displaying labeled-property graphs and are usually used to illustrate graph data. LPG diagrams can also be used to visualize graph schema, as will be shown here.
In an LPG diagram, nodes and edges are viewed as class objects that contain properties and labels. This approach defines how an LPG diagram is drawn.
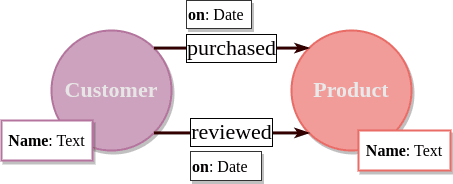
Boxes next to the nodes and edges contain their properties and the node color usually changes with the node label.
A limitation of LPG diagrams is that the edges can only connect two nodes with each other. That means that hyperedges are not supported in an LPG diagram and cannot be easily visualized. The schema of properties that are not single values, such as lists or arrays, also cannot be easily visualized.
ORM Diagrams
ORM diagrams (opens in a new tab) are specifically designed to visualize schema and schema rules. ORM has been designed for first-order logic making it an ideal tool to visualize relational knowledge graphs, and Rel programs in general.
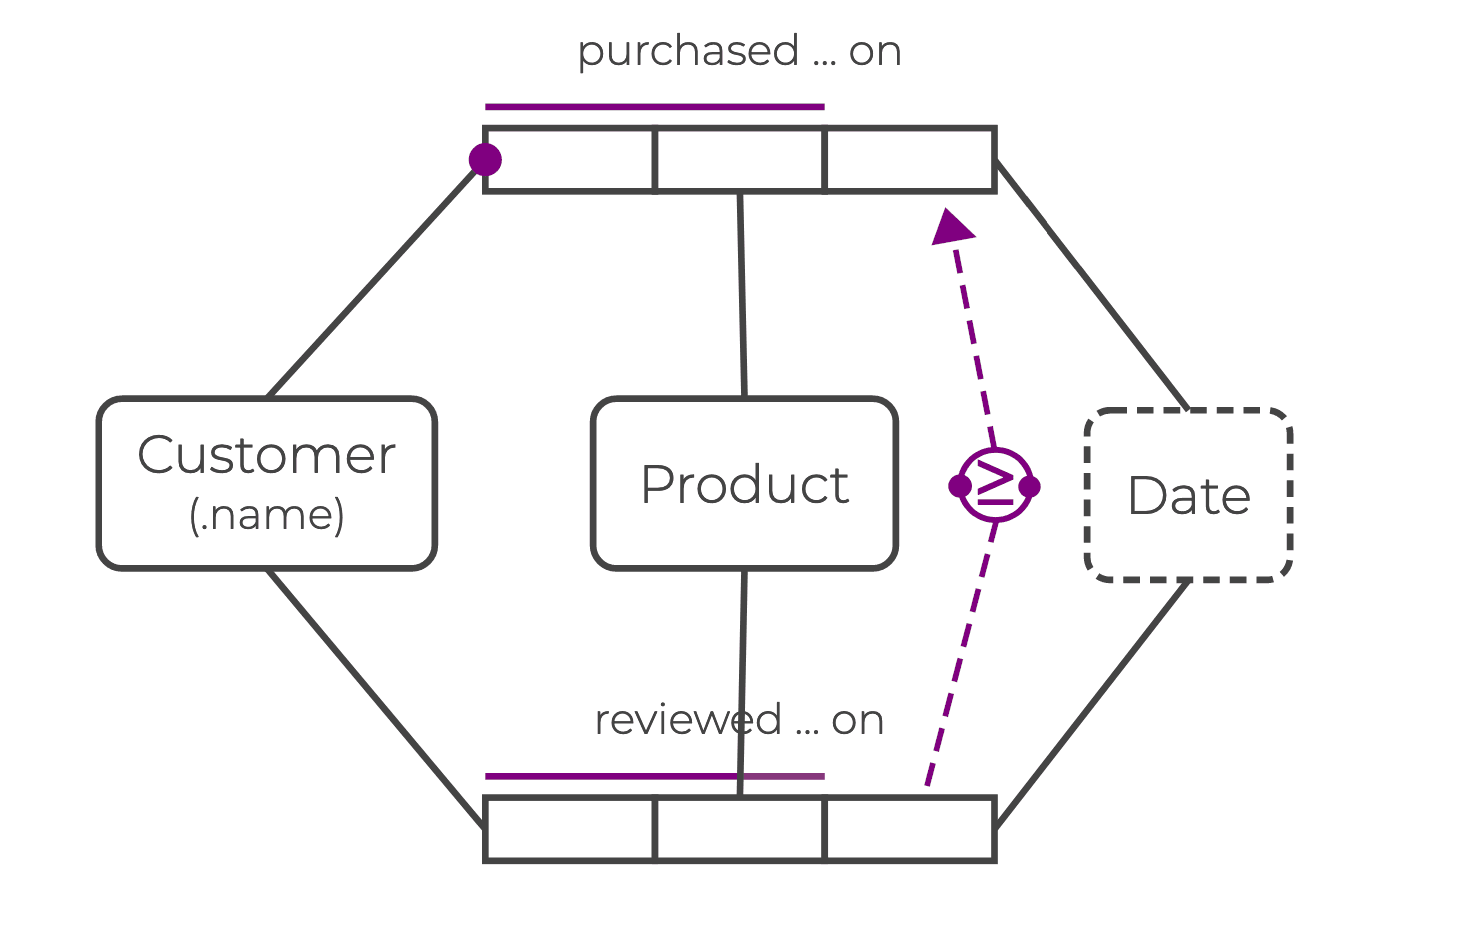
In ORM diagrams, edges are not represented as arrows, as in LPG diagrams, but through role boxes, and the number of boxes indicates how many concepts are connected to each other.
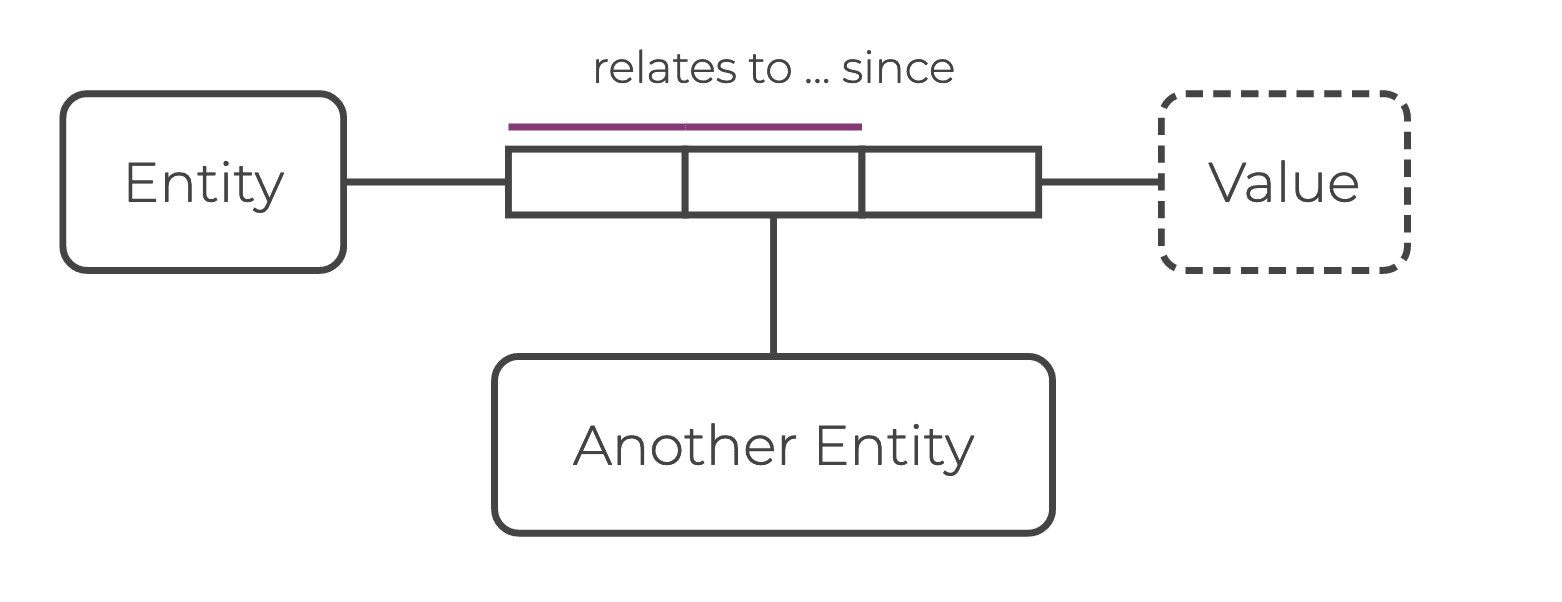
This makes it easy to visualize hyperedges like reviewed_on in ORM diagrams that connect two entities and a value with each other.
Additionally, ORM diagrams can also contain various schema rules like mandatory role or uniqueness constraints. These constraints are visualized in purple and apply to role boxes.
Nodes
A node represents a “thing” or “noun” in your schema. A node can represent a physical thing (product, person, etc.) or an abstract concept (transaction, US government, etc.).
LPG
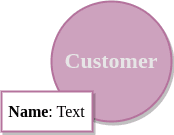
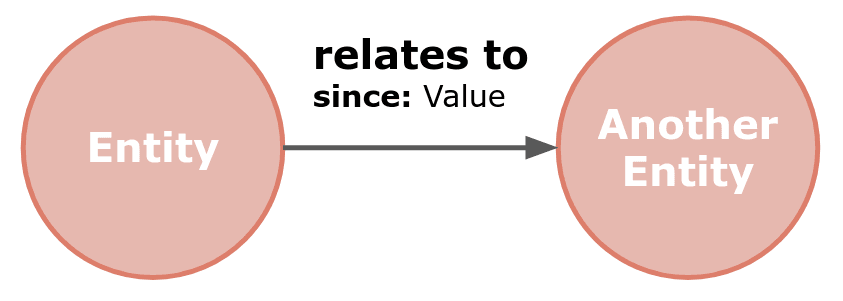
An LPG schema diagram represents entity nodes as circles. Node properties, which in Rel are modeled as value nodes, are visualized next to a node (usually in a box). Node properties cannot exist without a relationship with an entity node.
ORM
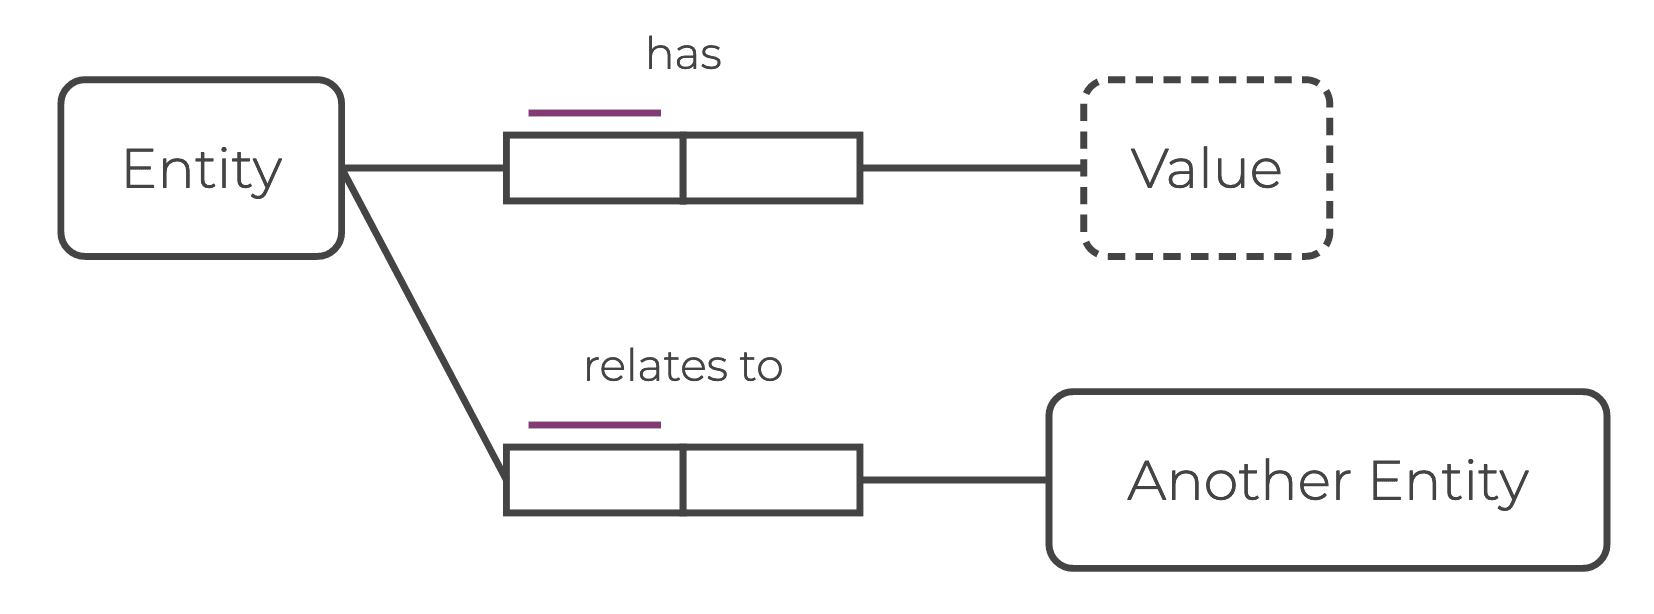
An ORM schema diagram represents both entity and value nodes as rounded boxes. Entities and value types are distinguished with solid versus dashed borders respectively.

Edges
If nodes are the “things” of your graph, edges describe “relationships” between things. They are the verbs that connect your nouns.
LPG
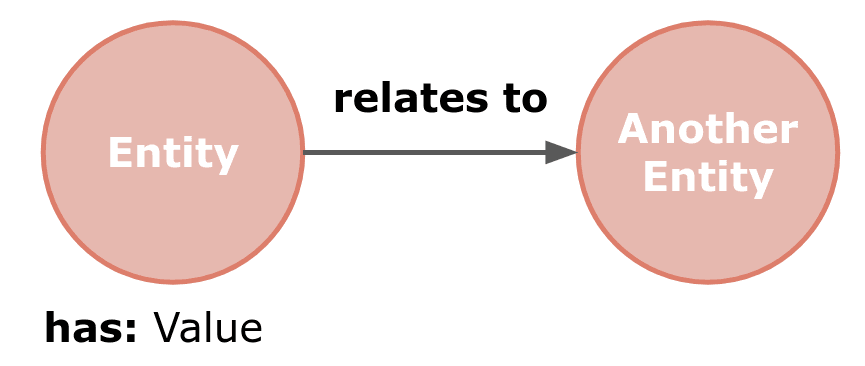
An LPG diagram represents edges between entity nodes as arrows. Edges can be directional or bidirectional (undirected). Edges must be binary, that is, they can only link two nodes. Edges connecting entity and value nodes (node properties) are not considered edges in the LPG diagram as these edges represent node properties that are usually displayed within a box next to the node.
ORM
An ORM diagram represents edges as a series of role boxes that connect two or more nodes. The number of role boxes in the diagram is the same as the arity of the edge relation. Binary edges are represented by two role boxes and hyperedges by three or more role boxes. A node property is represented as a value node connected to an entity node with a binary edge.
Hyperedges
A hyperedge connects three or more nodes — usually multiple entity nodes — with each other. However, any mix of entity or value nodes is possible. Edge properties are represented in Rel using hyperedges.
LPG
LPG diagrams do not support hyperedges explicitly. However, edges can have properties just as nodes can, and they are usually displayed next to the edge arrow as text.
ORM
ORM diagrams support hyperedges of any size. Edge properties are expressed as facts that connect two (or more) entity nodes and a value node. The ORM diagram can be read across the set of role boxes.
Constraints in ORM
Constraints in ORM diagrams (opens in a new tab) are represented by purple designs. In the diagram below you can see some of those constraints. You will also come across them in other guides on relational knowledge graphs.
Mandatory Role Constraints
A mandatory role constraint is symbolized by a large dot on the role box connector.

It indicates a mandatory connection of two facts — one fact from the node linked to the dotted role box and at least one from the other node. In the ORM diagram above, the mandatory role constraint means “each customer has bought some product.” In other words, in order to be a customer you have to have bought some product.
Uniqueness Constraints
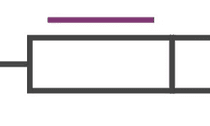
A uniqueness constraint is symbolized by a purple bar above the role box.
It indicates a unique connection of two facts — one fact from the node linked to the marked role box and only one from the other node. Depending on how the bars are displayed on the role boxes, they can indicate a one-to-many connection, a many-to-one connection (functional dependency constraint), a many-to-many connection, or a one-to-one connection. In the ORM diagram above, the internal uniqueness constraint means “a customer bought a product on at most one date.”
Value-Comparison Constraints
A value-comparison constraint is symbolized by a comparison operator in a large circle.
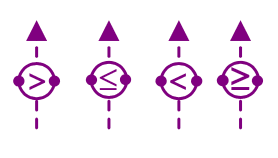
It indicates how the value of one role compares to the value of another role. In the ORM diagram above, the value-comparison constraint means “the review date has to be superior or equal to the purchase date.”
Summary
Components of a relational knowledge graph can be represented with ORM and LPG diagrams. ORM and Rel offer the advantage of representing hyperedges in addition to edges and nodes.
See Also
See Elements of a Relational Knowledge Graph to learn more about how to define nodes, edges, and hyperedges in Rel. It also provides a small example of how to build and query a relational knowledge graph. See also My First Knowledge Graph and The Lehigh University Benchmark for more examples.