Using the Viewers
The RelationalAI VS Code Extension contains:
- The RAI Output Viewer, which allows you to see the query output.
- The Graph Dependency Viewer, which provides you with a graph visualization of the dependency relationships between derived relations, including an interactive table for exploring the contents of each relation.
Using the RAI Output Viewer
Running code in Markdown files or clicking to view a base or derived relation opens the RAI Output Viewer.
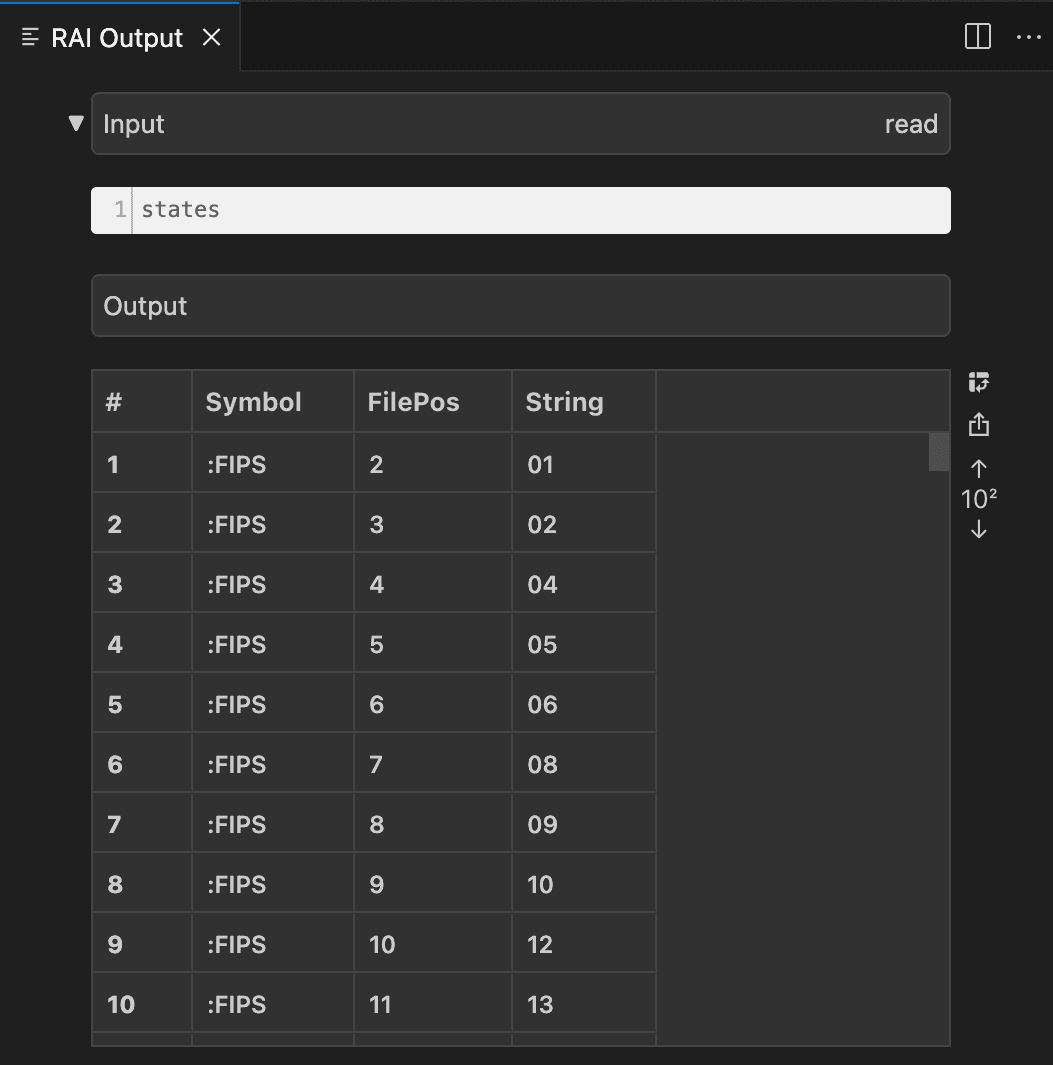
The RAI Output Viewer has two tabs:
- Input displays the query that is currently executing or was most recently executed.
- Output shows the result obtained by executing the query. Results are usually displayed as a table, but other rich output types like Graphviz and Vega-Lite are also supported.
The RAI Output Viewer also has several features to help you view and manage results in the table.
Here’s how to use these features:
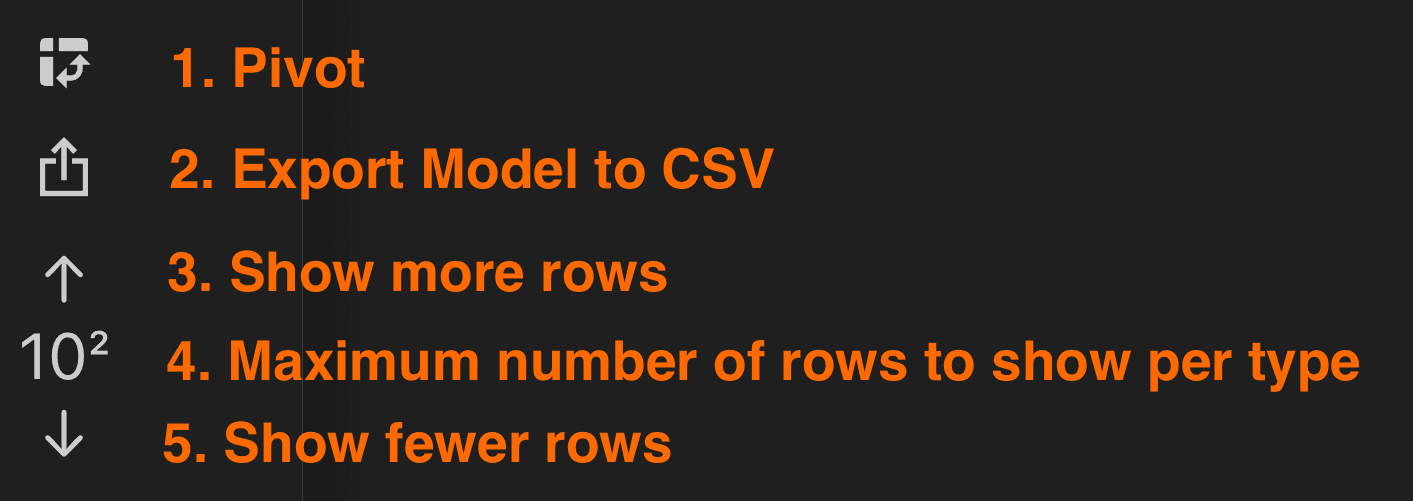
- To sort columns by Symbol, click the Pivot icon. You can click again to unpivot and return to the original view.
- To edit data or export the content as a CSV file, click the Export CSV to Editor icon. This opens the file in a new Editor where you can make changes and download the file to your machine.
- To show more rows, click the upward arrow.
- This button displays the maximum number of rows to show per specialization.
- To show fewer rows, click the downward arrow.
Using the Relation Dependency Graph Viewer
To view relation dependencies in your database:
- Move your pointer to or select the name of your database.
- Click the View Dependencies icon. This computes the dependencies between derived relations and displays the result as an interactive graph in the Relation Dependency Graph Viewer.
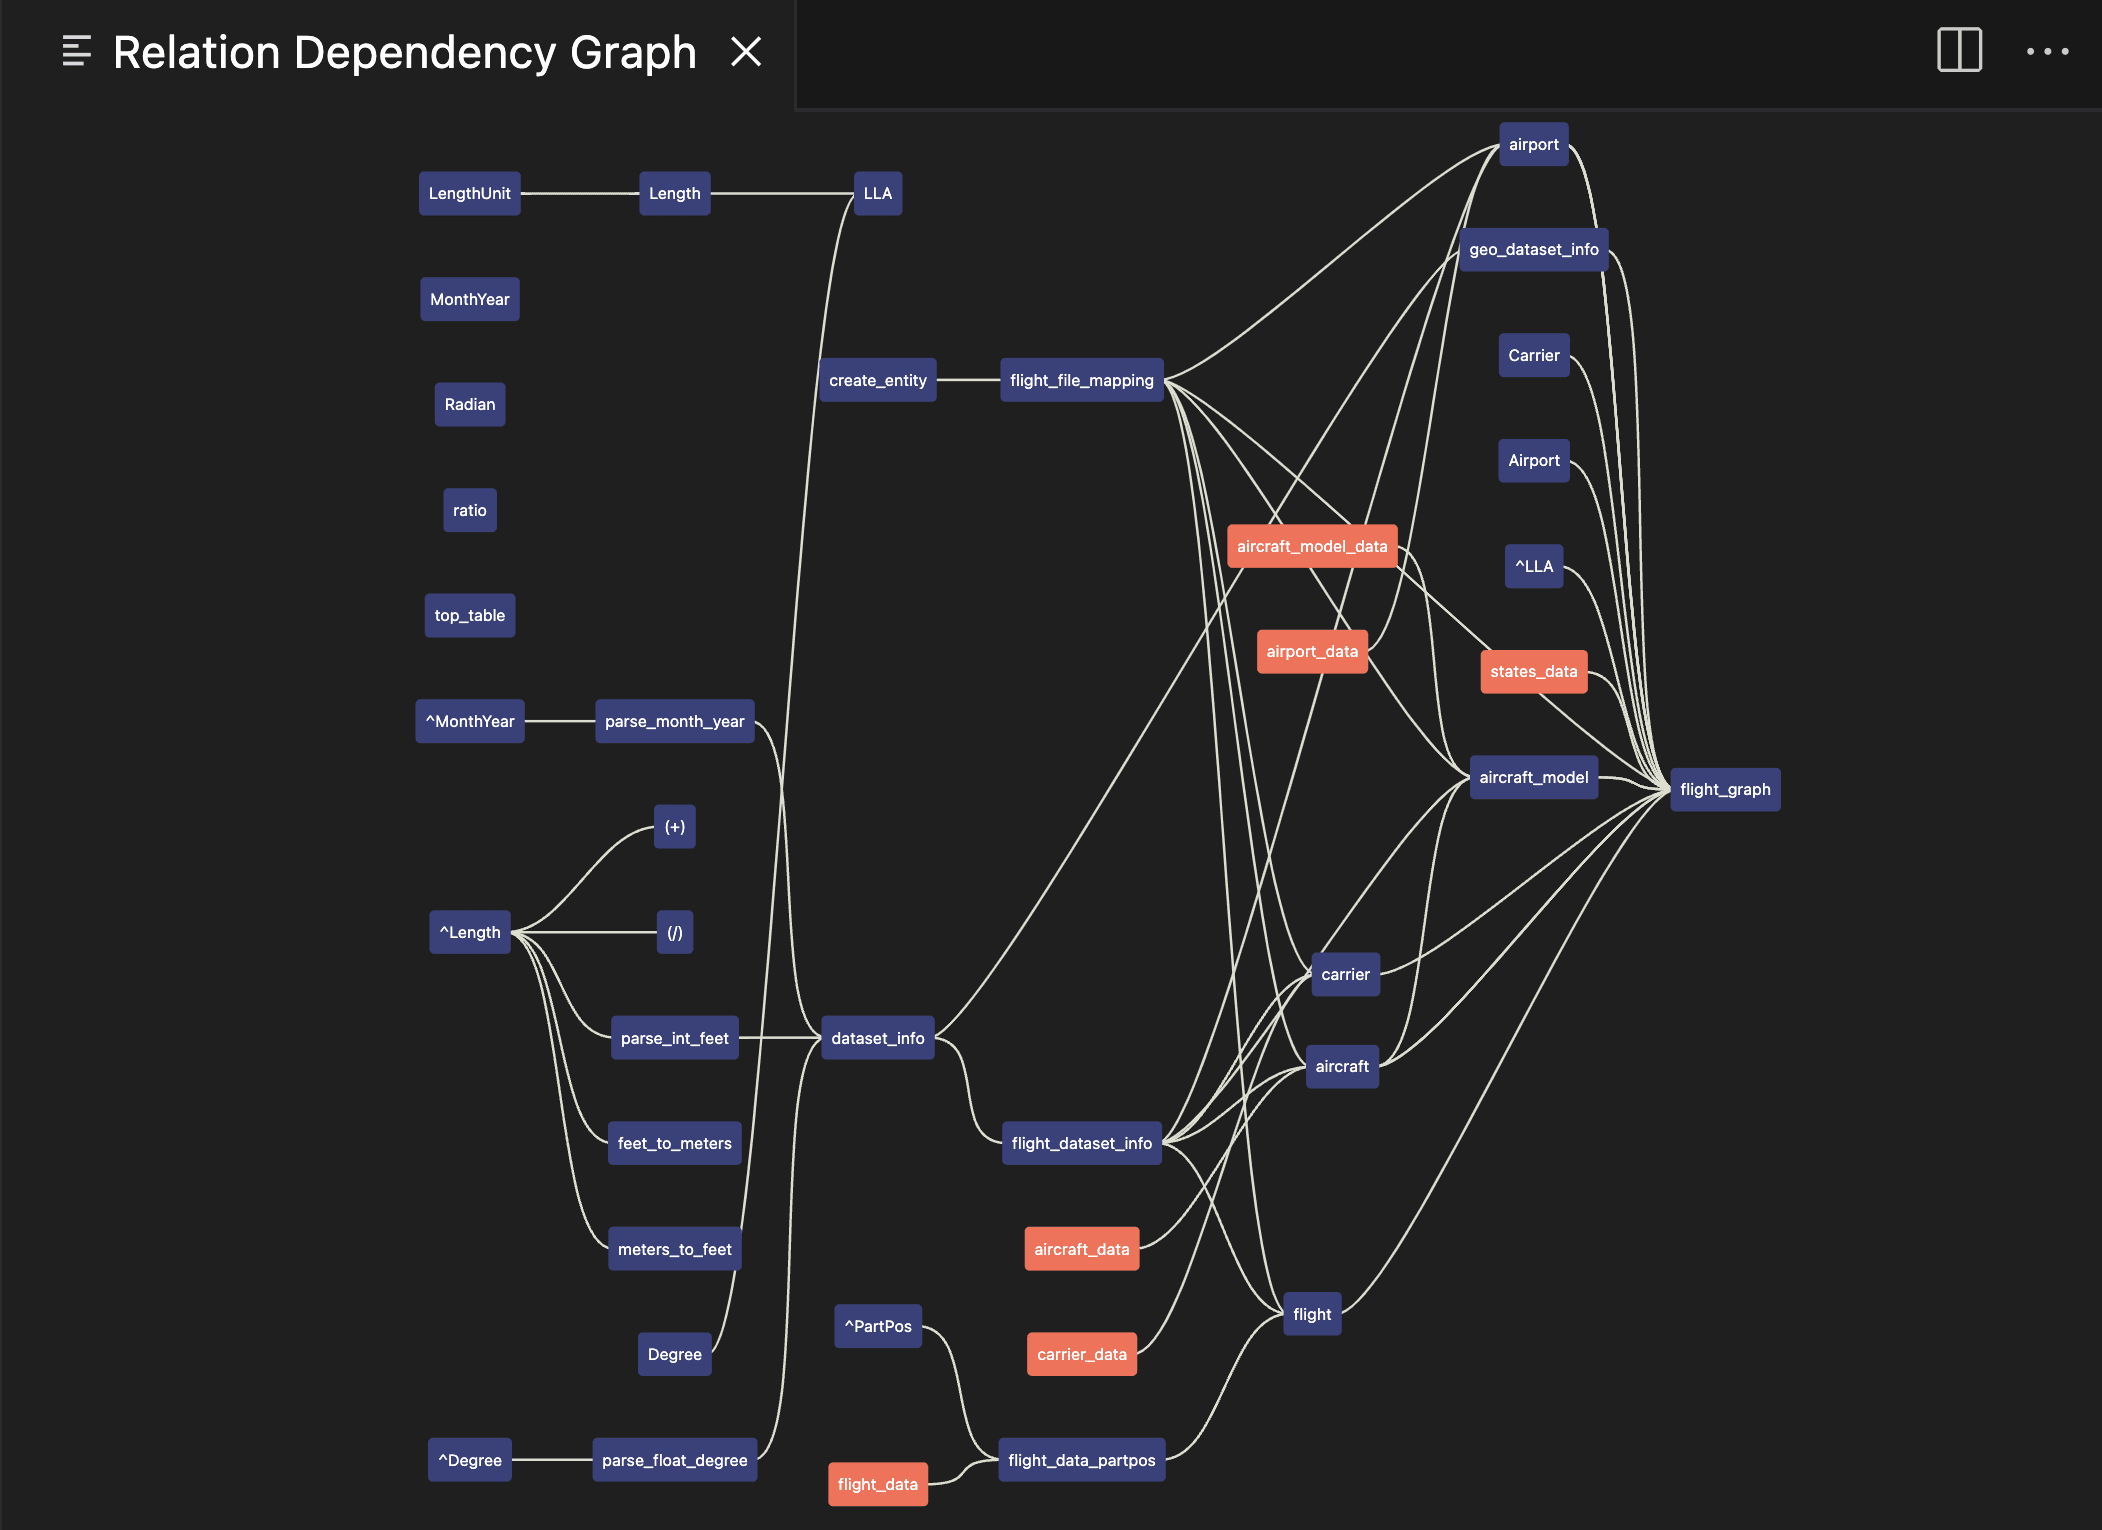
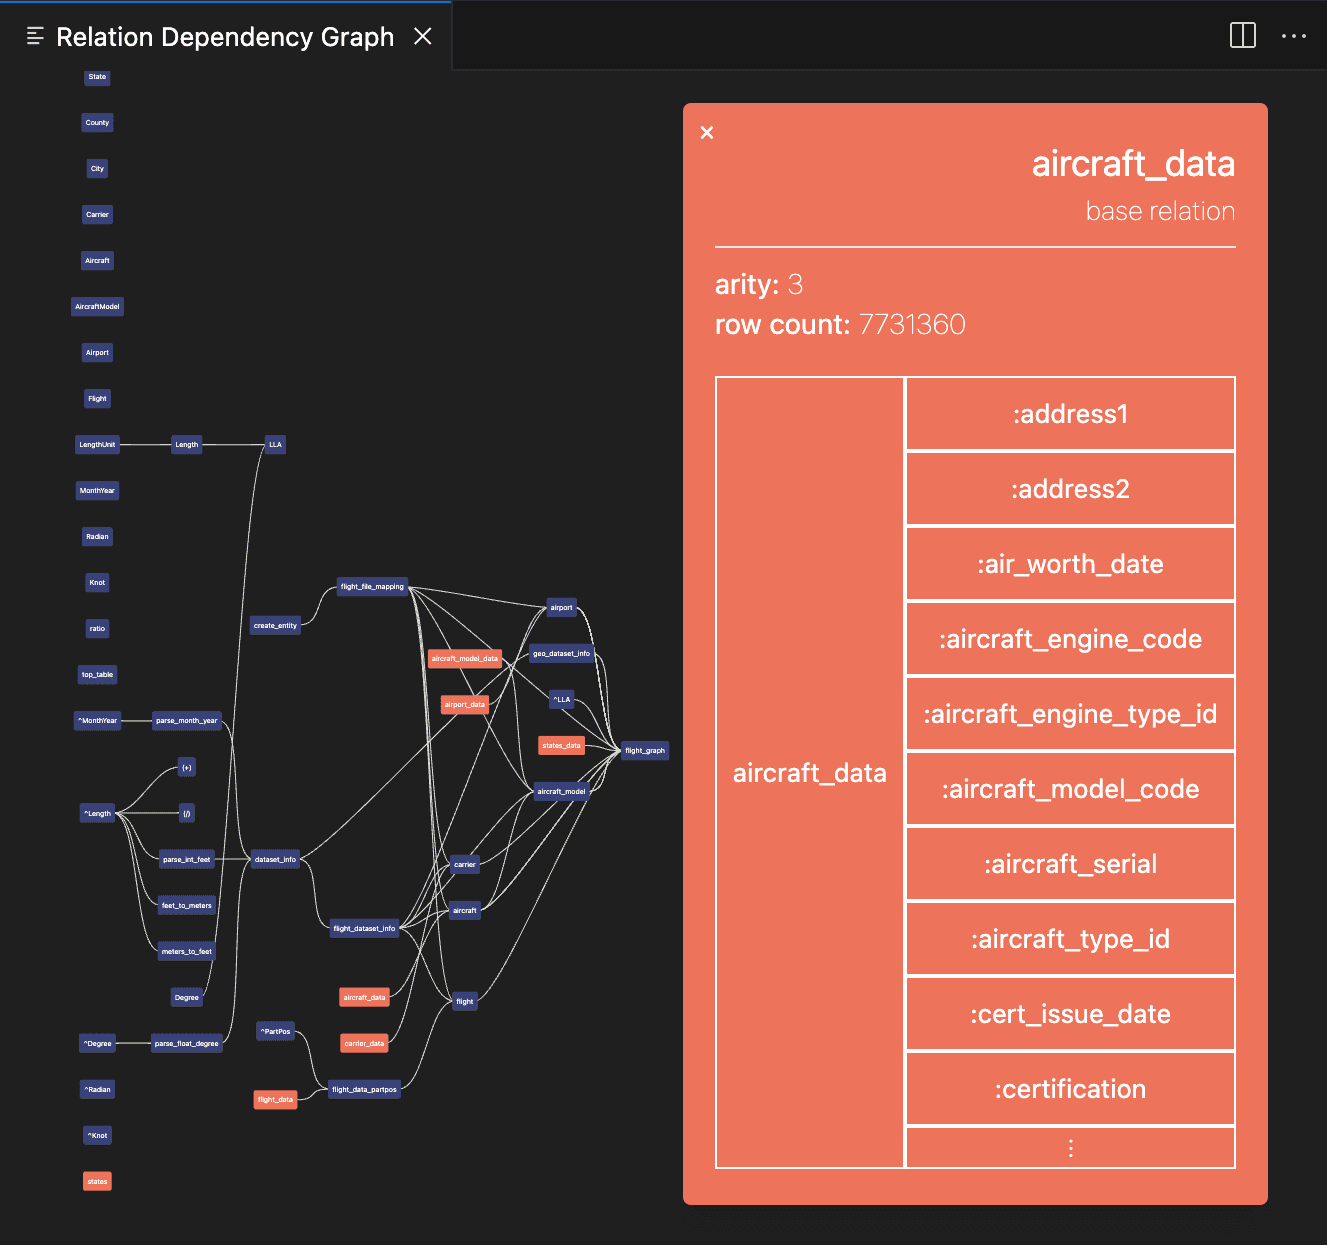
Base relations are highlighted in orange and derived relations in blue. Edges indicate that a particular derived relation references some other relation in its definition.
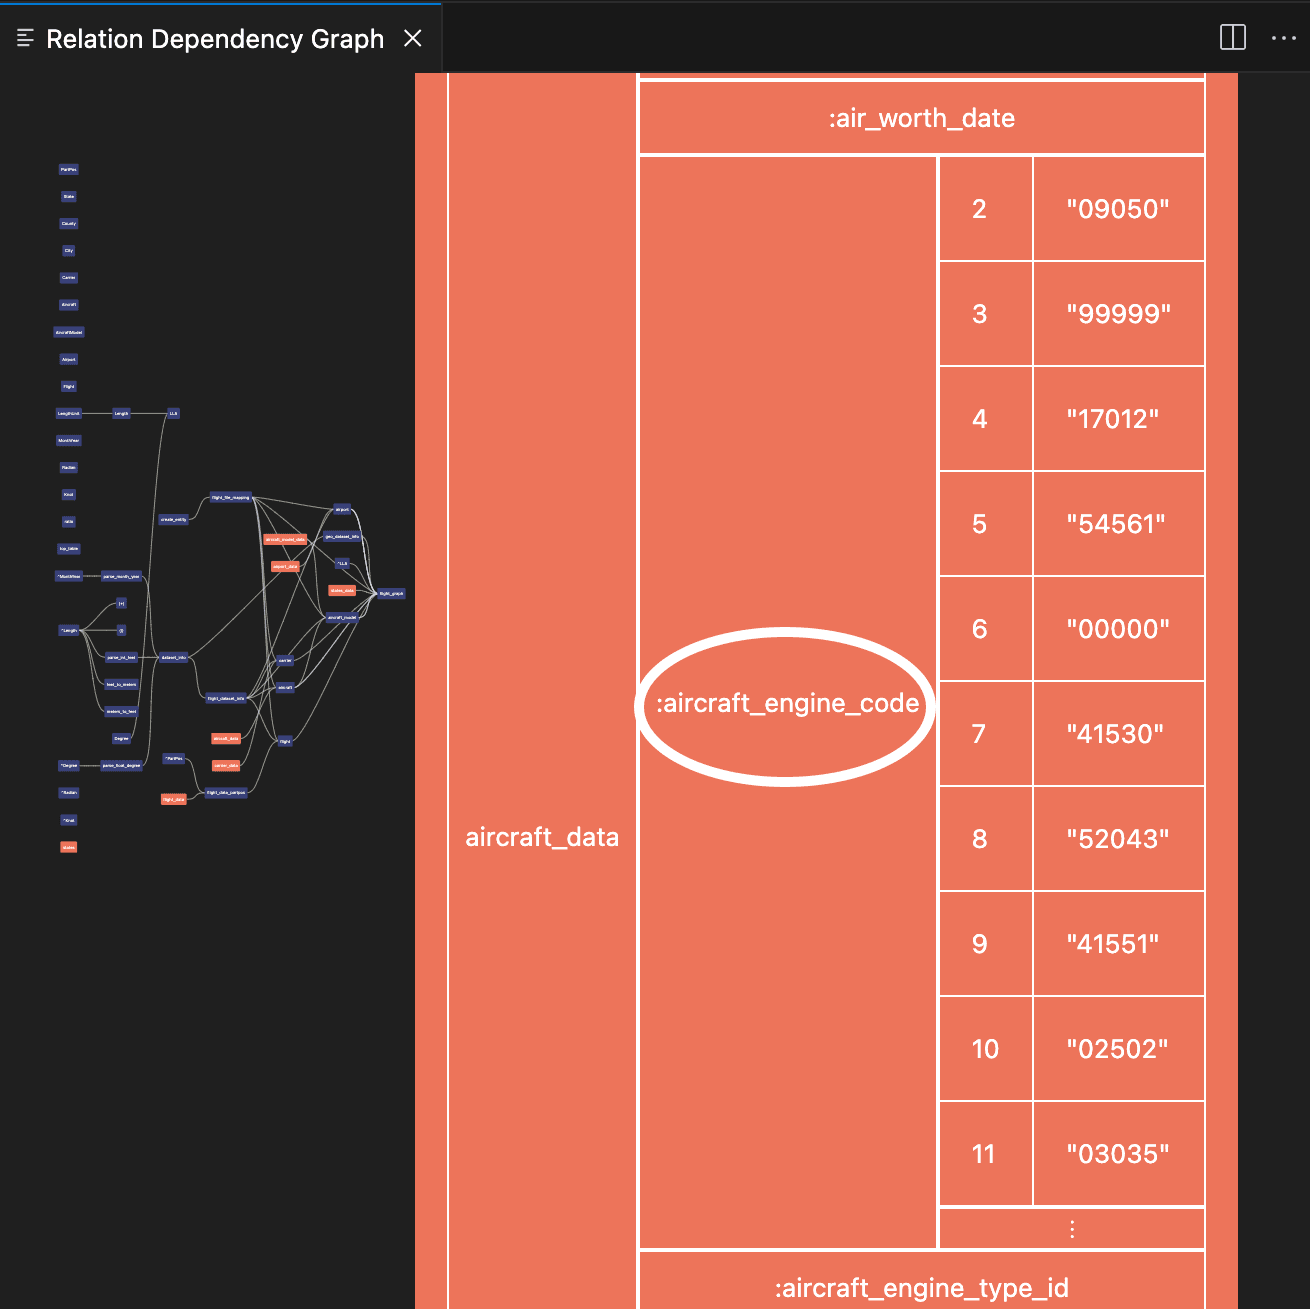
Exploring Relations
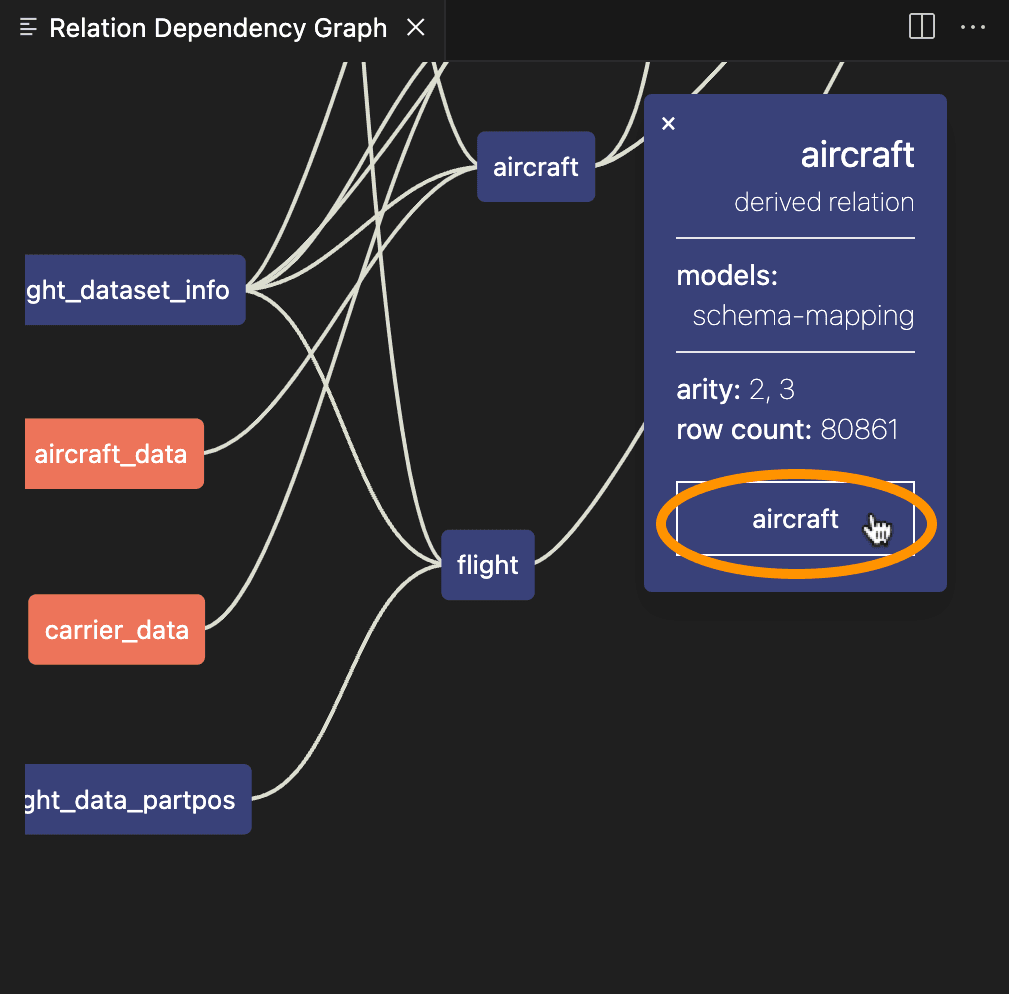
You can explore, get information, and preview the contents of relations displayed in the Relation Dependency Graph.
To do so, click any relation in the graph to select it. This opens a box displaying the type of the relation, the model it’s defined in (if applicable), and the number of columns and rows it has.
To view more details, click the name of the relation at the bottom of the box.
This displays the contents of the relation — subrelations — in table form.
Clicking on any subrelation displays a map of the code, including entities and values.